Parent Functions And Transformations
Parent Functions And Transformations
Parent Functions: When you hear the term parent function, you may be inclined to think of two functions who love each other very much creating a new function. The similarities don’t end there! In the same way that we share similar characteristics, genes, and behaviors with our own family, families of functions share similar algebraic properties, have similar graphs, and tend to behave alike.
Read Also: How To Use Sohcahtoa?
An example of a family of functions is the quadratic functions. All quadratic functions have the highest exponent of 2, their graphs are all parabolas so they have the same shape, and they all share certain characteristics. Well, that’s not exactly right; however, there are some similarities that we can observe between our own parents and parent functions. In mathematics, we have certain groups of functions that are called families of functions. Just like our own families have parents, families of functions also have a parent function.

Parent Functions Worksheet
*The Greatest Integer Function, sometimes called the Step Function, returns the greatest integer less than or equal to a number (think of rounding down to an integer). There’s also a Least Integer Function, indicated by \(y=\left\lceil x \right\rceil \), which returns the least integer greater than or equal to a number (think of rounding up to an integer).
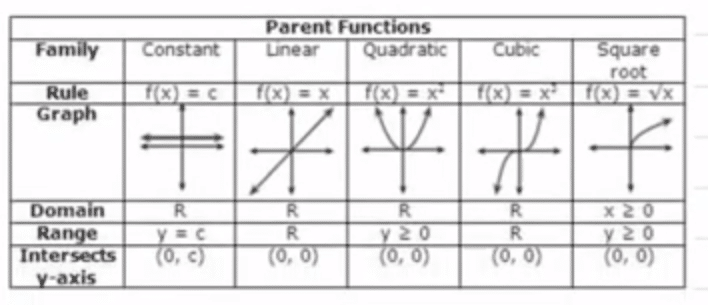
Again, the “parent functions” assume that we have the simplest form of the function; in other words, the function either goes through the origin \(\left( {0,0} \right)\) or if it doesn’t go through the origin, it isn’t shifted in any way.
Notes on End Behavior: To get the end behavior of a function, we just look at the smallest and largest values of \(x\), and see which way the \(y\) is going. Not all functions have end behavior defined; for example, those that go back and forth with the \(y\) values and never really go way up or way down (called “periodic functions”) don’t have end behaviors.

Most of the time, our end behavior looks something like this:\(\displaystyle \begin{array}{l}x\to -\infty \text{, }\,y\to \,\,?\\x\to \infty \text{, }\,\,\,y\to \,\,?\end{array}\) and we have to fill in the \(y\) part. So the end behavior for a line with a positive slope is: \(\begin{array}{l}x\to -\infty \text{, }\,y\to -\infty \\x\to \infty \text{, }\,\,\,y\to \infty \end{array}\).
There are a couple of exceptions; for example, sometimes the \(x\) starts at 0 (such as in the radical function), we don’t have the negative portion of the \(x\) end behavior. Also, when \(x\) starts very close to 0 (such as in in the log function), we indicate that \(x\) is starting from the positive (right) side of 0 (and the \(y\) is going down); we indicate this by \(\displaystyle x\to {{0}^{+}}\text{, }\,y\to -\infty \).
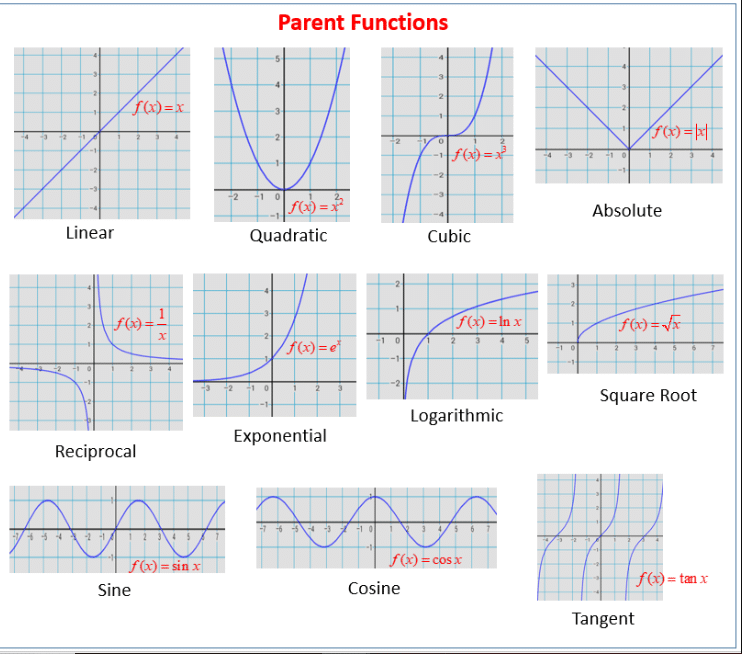
What are the 8 parent functions?
- The Exponential Function is f(x)=e.
- x.
- The Linear Function is f(x)=x.
- 8 Parent Functions.
- The Logistic Function is f(x)= 1. 1+e.
- Looking for boundedness.
- The Cubing Function is f(x)=x.
- The Cosine Function is f(x)=cos x.
What is an example of a parent function?
Parent Functions Graphs
Includes basic parent functions for linear, quadratic, cubic, rational, absolute value, and square root functions.
Match graphs to equations. Match family names to functions. Match graphs to the family names. Read cards carefully so that you match them correctly.
This is designed to be a matching activity. It will not work well as a flashcard activity.
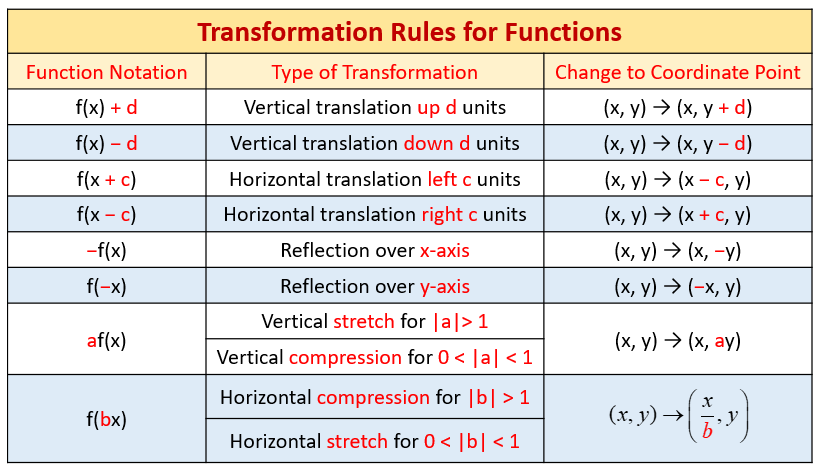
The following table shows the transformation rules for functions. Scroll down the page for examples and solutions on how to use the transformation rules.

Parent Functions Chart
T-charts are extremely useful tools when dealing with transformations of functions. For example, if you know that the quadratic parent function \(y={{x}^{2}}\) is being transformed 2 units to the right, and 1 unit down (only a shift, not a stretch or a flip yet), we can create the original t-chart, following by the transformation points on the outside of the original points. Then we can plot the “outside” (new) points to get the newly transformed function:
| Transformation | T-chart | Graph | ||||||||
| Quadratic Function
\(y={{x}^{2}}\) Transform function 2 units to the right, and 1 unit down. |
Transformed: Domain: \(\left( {-\infty ,\infty } \right)\) Range: \(\left[ {-1,\,\,\infty } \right)\) |
 |
When looking at the equation of the moving function, however, we have to be careful.
When functions are transformed on the outside of the \(f(x)\) part, you move the function up and down and do the “regular” math, as we’ll see in the examples below. These are vertical transformations or translations, and affect the \(y\) part of the function.
When transformations are made on the inside of the \(f(x)\) part, you move the function back and forth (but do the “opposite” math – since if you were to isolate the x, you’d move everything to the other side). These are horizontal transformations or translations, and affect the \(x\) part of the function.
There are several ways to perform transformations of parent functions; I like to use t-charts since they work consistently with ever function. And note that in most t-charts, I’ve included more than just the critical points above, just to show the graphs better.
Parent Functions And Transformations Worksheet
As mentioned above, each family of functions has a parent function. A parent function is the simplest function that still satisfies the definition of a certain type of function. For example, when we think of the linear functions which make up a family of functions, the parent function would be y = x. This is the simplest linear function.
Furthermore, all of the functions within a family of functions can be derived from the parent function by taking the parent function’s graph through various transformations. These transformations include horizontal shifts, stretching, or compressing vertically or horizontally, reflecting over the x or y axes, and vertical shifts. For example, in the above graph, we see that the graph of y = 2x^2 + 4x is the graph of the parent function y = x^2 shifted one unit to the left, stretched vertically, and shifted down two units. These transformations don’t change the general shape of the graph, so all of the functions in a family have the same shape and look similar to the parent function.
Algebraically, these transformations correspond to adding or subtracting terms to the parent function and to multiplying by a constant. For example, the function y = 2x^2 + 4x can be derived by taking the parent function y = x^2, multiplying it by the constant 2, and then adding the term 4x to it.
Read Also: What Are Agents of Socialization?


